EnergyStorageSystem-1200x799.jpg

April 13, 2023

The California Public Utilities Commission (CPUC) recently passed the NEM 3.0 bill, which brings significant changes to the state’s net metering policy compared to the previous NEM 2.0. As a homeowner or business owner interested in solar, it’s essential to understand the differences between the two policies and the new opportunities they present. In this blog post, we will explore the key differences between NEM 2.0 and NEM 3.0, and how to effectively sell solar panel systems to maximize savings under the new policy.


NEM 2.0 vs. NEM 3.0: Key Differences

The Value of Export Rates

Under NEM 2.0, customers received a full retail rate for any excess electricity they exported to the grid, allowing for a faster return on investment (ROI) in solar energy systems. With NEM 3.0, export rates have been reduced by about 75%, meaning customers will receive less money for the energy they sell back to their utility company. As a result, it may take longer for homeowners to recoup their investment in solar energy.

Instantaneous Netting

NEM 2.0 calculated electricity rates every hour based on a user’s net generation and usage during that hour, which was more favorable for solar customers. NEM 3.0 introduces instantaneous netting (or rapid cycling), allowing meters to communicate in real-time instead of hourly. This change may result in less financial benefit for solar customers and more complex calculations.

Grid Participation Charge

NEM 3.0 introduces a “Mandatory Grid Participation Charge” that requires all participants to pay a fee for using the network’s resources and services. Solar customers can expect to pay an extra $8 charge per kilowatt (kW) of solar power capacity, resulting in an average additional cost of $48 per month for homeowners, further reducing solar energy savings.


Strategies for Maximizing Solar Savings under NEM-3.0

Emphasize long-term savings and environmental benefits

Despite the policy changes, solar energy systems still offer significant long-term savings on electricity bills and environmental benefits. Communicate the long-term advantages and the positive environmental impact of solar energy investments, such as reducing greenhouse gas emissions and conserving natural resources.

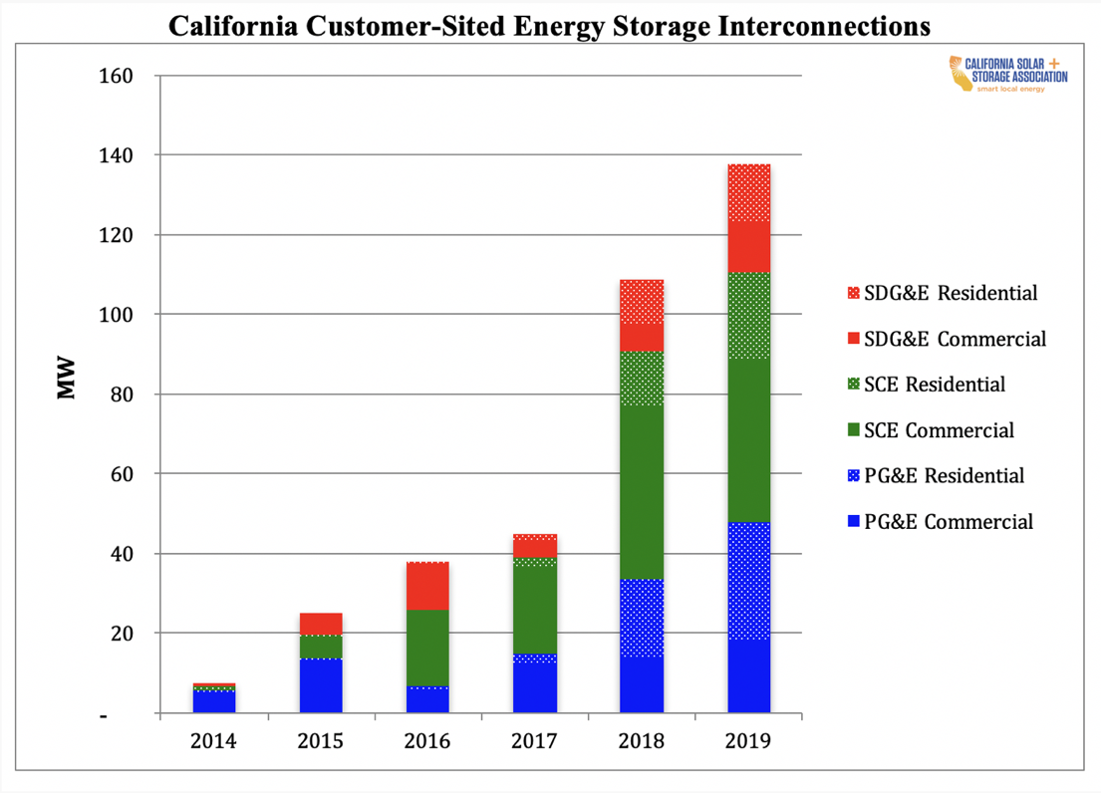
Promote solar+storage solutions

With NEM-3.0 encouraging battery storage adoption, solar providers can promote solar+storage solutions to maximize self-consumption, take advantage of time-of-use (TOU) rates, and provide backup power during outages. By incorporating battery storage, customers can offset the reduced export rates and increased grid participation charges under NEM 3.0, achieving substantial long-term savings.

Offer tailored solar+storage solutions

With NEM-3.0 encouraging battery storage adoption, solar providers can promote solar+storage solutions to maximize self-consumption, take advantage of time-of-use (TOU) rates, and provide backup power during outages. By incorporating battery storage, customers can offset the reduced export rates and increased grid participation charges under NEM 3.0, achieving substantial long-term savings.

Leverage available incentives and financing options

Despite the higher initial costs of solar+storage systems, customers can still take advantage of various incentives, such as the federal solar Investment Tax Credit (ITC), California’s Self-Generation Incentive Program (SGIP), and other state and local incentives. Additionally, offering flexible financing options like solar loans, leases, and power purchase agreements (PPAs) can make these systems more accessible to a wider range of customers.

Build trust through transparency and education

Establish credibility with your customers by being transparent about the costs, savings, and potential challenges associated with solar+storage installations under NEM-3.0. Provide honest and accurate information, and educate your customers about how solar+storage systems can help them maximize their savings and reduce their environmental impact. By fostering long-lasting relationships built on trust and transparency, you will position yourself as a valuable partner in their clean energy journey.


Conclusion: Learn to thrive in California’s dynamic solar energy market

Although the NEM 3.0 policy brings significant changes to California’s net metering landscape, there are still opportunities for solar providers to help customers maximize their savings. By understanding the key differences between NEM 2.0 and NEM 3.0, promoting solar+storage solutions, offering tailored recommendations, and leveraging available incentives, you can help your customers make informed decisions and achieve long-term savings. By adapting your sales strategies and focusing on the benefits of solar+storage, you can continue to thrive in California’s dynamic solar energy market.


solar-professional-2-1200x854.png

March 8, 2023

In today’s rapidly changing world, companies are always looking for ways to streamline their processes and provide their customers with the best possible experience. SepiSolar is no exception. As a leading provider of renewable energy engineering and planning, the company is constantly seeking new and innovative ways to improve its services and stay ahead of market demand.

That’s why we are excited to announce that we are now able to perform in-person site surveys! Led by Peter Florin, our resident electrical contractor of 45 years, SepiSolar is now able to perform site surveys for projects in California.


In-Person Surveys Reduce Project Costs

In the past, SepiSolar relied on 3rd parties or remote surveying techniques to gather information about potential sites for renewable energy installations. While these methods were fast and cost-efficient in the beginning, they had their limitations and impacts to cost and schedule further down the project timeline. For example, remote surveys often lacked the detail and accuracy needed to provide a comprehensive assessment of a site. This could lead to clarifications that are found late in the design process, which could lead to issues during planning and construction that ultimately lead to change orders, impacting project costs and schedules.

With in-person site surveys, SepiSolar is able to gather much more detailed and accurate information about a potential site. The survey team will visit the site in question, assess the physical and environmental conditions, and gather data on factors such as potential electrical interconnection locations, electrical upgrade needs, conduit paths, and even roof details for structural feasibility analysis. This information will be used to streamline the design process, mitigate negative impacts to cost and schedule, and reduce construction risks.

site survey


SepiSolar is Committed to Strong Industry Relationships

In-person site surveys also provide SepiSolar with the opportunity to interact with the site owners and other stakeholders. This allows the company to answer any questions they may have, address their concerns, and provide a more comprehensive and personalized solution. This level of customer engagement and support is essential for building strong, long-lasting relationships with clients.

The addition of in-person site surveys to SepiSolar’s services is just one of the many ways that the company is driving innovation in the energy industry. With a commitment to providing the best possible experience for its customers, SepiSolar is poised to continue growing and evolving to meet the ever-changing needs of the market.


SepiSolar Leads the Way for Renewable Energy Design and Engineering

SepiSolar’s ability to perform in-person site surveys is a major step forward for the company and a significant development in the energy industry. With more accurate and detailed information about potential sites earlier in the process, SepiSolar can minimize project costs while designing the most effective and efficient renewable energy systems. By putting the customer at the center of its services, SepiSolar is positioning itself for long-term success.


IP.png

December 23, 2022

Last month we launched a Thanks/Giving program that expressed gratitude to our clients for their loyal business in 2022. With that gratitude we wanted to give back. We searched for an organization that fit not only the mission and goals of SepiSolar, but also the missions and goals of most of our clients so that, in a way, we were donating on their behalf. We searched for an organization that supported the growth of the solar industry, and alleviated burdens of low income and disadvantaged communities.

On Wednesday, November 23rd, we announced that 1% of SepiSolar’s expected 2022 net income would be donated to GRID Alternatives. In this month’s blog post, we’d like to tell you more about Grid Alternatives, and why we feel they’re a good fit for our Thanks/Giving program.


About Grid Alternatives

GRID Alternatives is a non-profit organization that works to promote and provide access to clean, renewable energy for low-income communities. Its mission is to make renewable energy technology and training accessible to underserved communities, and to promote the use of renewable energy as a means of addressing social, economic, and environmental issues.

GRID Alternatives works on a variety of projects in the United States and internationally, including the installation of solar panels on the homes of low-income households, the development of community solar projects, and the implementation of energy efficiency measures in affordable housing. The organization also provides job training and education programs for individuals from underserved communities, helping them to enter the renewable energy industry.

GRID Alternatives’ work has a number of impacts, including reducing greenhouse gas emissions, improving public health by reducing air pollution, and providing affordable access to clean energy for low-income households. The organization’s job training programs also help to create career opportunities in the growing renewable energy industry, particularly for individuals from underserved communities who may have previously had limited access to these types of jobs.


GRID Alternatives Helps Low Income Families

GRID Alternatives has a number of specific impacts on low-income families:

1. Reduced energy bills: By installing solar panels on the homes of low-income households, GRID Alternatives helps to reduce energy bills and make energy more affordable for these families. Solar panels can generate a significant portion of a household’s energy needs, which can result in significant savings on monthly energy bills.

2. Improved health: GRID Alternatives’ work helps to reduce air pollution, which can have a number of health benefits for low-income communities. By promoting the use of clean, renewable energy sources, GRID Alternatives helps to reduce the negative health impacts of air pollution, such as respiratory issues, heart disease, and stroke.

3. Economic benefits: GRID Alternatives’ job training programs can provide economic benefits for low-income families by helping individuals from these communities enter the renewable energy industry and gain access to well-paying, stable jobs.

4. Environmental benefits: GRID Alternatives’ work helps to reduce greenhouse gas emissions and protect the environment. By promoting the use of clean, renewable energy sources, GRID Alternatives helps to reduce the negative environmental impacts of fossil fuel use, such as air pollution and climate change.

Overall, GRID Alternatives’ work helps to improve the quality of life for low-income families by reducing energy costs, improving health, providing economic opportunities, and protecting the environment.


GRID Alternatives Trains the Next Generation of Solar Professionals

GRID Alternatives provides a variety of training programs to help individuals enter the renewable energy industry and become solar professionals. These programs include:

1. Hands-on training: GRID Alternatives provides hands-on training opportunities through its solar installation projects, where individuals can work alongside experienced solar professionals and learn about solar panel installation and other related skills.

2. Formal education programs: GRID Alternatives offers a range of formal education programs, including courses and certification programs, to help individuals learn about renewable energy and gain the knowledge and skills needed to become solar professionals.

3. Apprenticeship programs: GRID Alternatives offers apprenticeship programs that provide on-the-job training and education, allowing individuals to learn from experienced professionals while also earning a wage.

4. Job placement assistance: GRID Alternatives provides job placement assistance to help individuals who have completed its training programs find employment in the renewable energy industry.

Overall, GRID Alternatives’ training programs are designed to provide individuals with the knowledge and skills needed to enter the renewable energy industry and become solar professionals, with a focus on helping individuals from underserved communities gain access to these types of careers.


During this season of giving, we encourage everyone to give generously to an organization they believe will make the world a better place. We chose GRID Alternatives. Whatever your focus or beliefs, let’s all find ways to contribute, to give back, and to uplift those less fortunate than us.

From all of us here at SepiSolar, Happy Holidays and Happy New Year.


SEPI_Image_Interconnection-reform.png

September 1, 2022

This summer, the California Public Utilities Commission rolled out a new set of rules for utilities to decide when solar and energy storage projects get permission to interconnect with the grid. We’ll share some information that has helped us understand what’s happened, plus a short Q&A we put together with support from the Interstate Renewable Energy Council (IREC), an advocate for regulations supporting clean energy adoption and a driving force for the new rules.

Interconnection is a mission-critical step in renewable energy project development. To get interconnection approval, projects have to show they can operate safely and reliably and prevent grid disruptions. Projects need an interconnection agreement before they can start exporting energy to the grid.

California, like many states, has had long-standing rules to screen projects for potential to compromise grid reliability so projects can be approved to interconnect faster when the risk of grid disruption is de minimis. But as more renewable energy projects come online, fewer projects are passing this screen.


Out: 15% limits on annual peak load

Under the old rules, projects passed this screen, avoiding additional time-consuming studies by the utility, if distributed energy made up less than 15 percent of the annual peak load on the nearest electric distribution lines. Once distributed generation topped the 15 percent limit, projects could be held up for further review. In a recent PV Magazine article, one project developer said commercial and industrial solar projects often wait more than three years for interconnection approval.

California’s new rules ditch the 15 percent threshold and replace it with a more precise analysis of the grid’s operational limits, known as a hosting capacity analysis (HCA). The analysis, as described on the IREC website, shows where distributed energy projects can seamlessly interconnect to the grid. It also shows where solar and storage can add value to the grid and where network upgrades are needed most.

Want to find out how suitable a project site would be for solar and energy storage projects? Here are maps with results from the latest analyses for California’s three investor-owned utilities.

PG&E and SDG&E require you to register and login before viewing their maps. PG&E provided instant access. SDG&E granted us access after a six-day wait.

The Sepi team would like to smooth the transition for the California contractors we work with, and help inform the manufacturers, contractors and consultants we’re in contact with throughout the industry. See our Q&A with IREC Communication Director Gwen Brown below. Responses have been edited for length. If you have more questions, share them with us on LinkedIn.

What should California contractors do to get prepared for the new interconnection process before it takes effect?

Familiarize yourselves with the hosting capacity analysis of the investor-owned utilities in the territories where you operate.


In: Hosting capacity analysis

How easy is it for contractors to view a hosting capacity analysis to know how a project might be affected by grid constraints in the interconnection process?

Searching an HCA map is like searching any online map, like Google Maps. Just enter the address to view a section of the grid and select the data you want to display. Each map has a legend and user guide for reference.

Here’s a map of the grid closest to the SepiSolar office in Fremont, California, showing the amount of PV generation that can be installed without any thermal, voltage, distribution protection or operational flexibility violations at the time the HCA analysis was performed. Lines with no capacity are colored in red. Lines with more than 2 MW of capacity are green. Purple and light blue show transmission and feeder lines.

Sample of a hosting capacity analysis map

Using tables, you can also view HCA data to find out precisely how much capacity is available for new generation.

Which projects will be eligible for expedited review?

The HCA is the new form of expedited review for all distributed energy resource projects, including solar and energy storage on both sides of the meter. From IREC’s press release: “Under the newly adopted rules, projects that do not exceed 90% of available capacity as shown in the ICA (a conservative buffer requested by utilities) will be able to pass the new screen. Projects that do not pass this improved screen will be subject to supplemental reviews; however, the rule changes also include significant improvements to the supplemental review process that are expected to allow a greater amount of DERs to be integrated through the screening process.”

All projects are now eligible for this review process. If you know a project will fail the HCA screen (that is, it exceeds 90 percent of available capacity), you might want to take another path, such as going directly to supplemental review.

When will contractors notice a difference in the interconnection queue?

Good question. Nobody truly knows the answer yet. It depends how the utilities manage the transition. Review times may vary from one utility to the next. In theory, at least, HCA maps can allow for rapid approval where the grid shows capacity for new projects.


The future of interconnection in California and beyond

Will there be differences in the way projects are treated across California’s three investor-owned utilities, its munis, and other electric service providers?

The process should be the same for each of the investor-owned utilities. Munis and other providers may not have the resources to perform an HCA. The details for each utility can be found in utility advice letters submitted during regulatory proceedings. Here is PG&E’s 342-page advice letter. The advice letter from Southern California Edison can be found here. A search for the file from SDG&E, Advice Letter 3677-E-B, on the utility’s web page hosting electric filings to the CPUC produced no results.

Is there any indication that another state will soon follow in California’s footsteps on streamlined interconnection?

According to IREC’s records on hosting capacity adoption in the US, last updated in February, 16 states are using HCA data in some form or another. The group includes New York, New Jersey, North Carolina, Michigan, Colorado, and Hawaii. A major limitation here is that the HCA has to be of high quality in order to be used for grid interconnection. California was the first to develop HCAs and has the best systems. A handful of other states (see HCA page linked above) have HCAs but most still have further work to do to get them to the point that they are ready for this application.

What other changes can California and other states make going forward to further simplify interconnection?

In the future, the plan per prior proceedings is that hosting capacity data will be used to allow developers to propose seasonal operating profiles for their projects so they could limit export in times when the grid has excess generation (such as spring, before load increases with AC use), and export more during times when that generation is needed on the grid (in summer). That concept was approved in Sept. 2020. Further work is needed to iron out the details. The timeline for that proceeding remains unclear. To learn more about emerging standards for scheduling the import and export of solar, energy storage, and other distributed energy resources, see Chapter 9 of IREC’s BATRIES toolkit for storage and solar-plus-storage interconnection.


Feature image by PG&E, accessed Sept. 1, 2022. PG&E updates ICA values on a monthly basis when significant changes to the feeder occur. Register for an account and login to see the most up-to-date maps in your service territory.


aerial-top-view-of-engineer-man-or-workerpeople-with-solar-panels-or-picture-id1310743276.jpg

June 8, 2022

Fire safety has always been a hot topic in commercial and industrial solar, now as much as ever.

First responders need to know that crews won’t be put in harm’s way in the event of an emergency. Section 690.12 of the National Electrical Code has led many C&I projects to adopt extra equipment that can reduce system voltage at the flip of a switch.

Contractors have to adhere to safety standards. But they also have to look for opportunities to simplify construction and keep costs under control. Compliance can increase system costs, requiring additional hardware, longer installation times, and time-consuming operations and maintenance.

Manufacturers are starting to bring forward solutions that aim to address safety, simplicity, and cost. Inverter maker SMA America and mounting system supplier Sollega have obtained certification showing that the Sollega FastRack 510 and the SMA Sunny Tripower CORE1 meet the Underwriters Laboratory (UL) 3741 definition of a Photovoltaic (PV) Hazard Control System, as first reported by Solar Builder.

The finding is significant. It means projects can meet rapid shutdown requirements without needing module-level power electronics or mid-circuit interrupters. With permitting approval, contractors can look forward to a whole new category of system design options for rapid shutdown compliance. Sepi provides system design among our project planning services.

But one big question remains: What will the authorities having jurisdiction do?


AHJs are key stakeholders

Developers and asset owners invest a lot of time and money in C&I projects. Investors want to mitigate risk. You increase the risk of project delays any time you stand first in line for approval with a new solution.

The US has more than 20,000 cities and counties. Naturally, we couldn’t ask each one for an opinion on PV Hazard Control Systems. But as a service to the industry, we selected 15 AHJs in communities that install high volumes of solar projects. We included municipalities from the East Coast, the Midwest, the Rocky Mountains, the Pacific Coast, and Hawaii.

We contacted agencies where our communications team had direct contact information for at least one senior official in the department. Many did not respond during the one-week response period we provided.

The variety of responses and the response rate, at 20 percent, underscores some of the industry’s perennial challenges with project permitting. Not only the inconsistency from one jurisdiction to another but sometimes a lack of transparency.

Here are the responses we received.

UL 3741 approval in Sacramento, California

Michael Bernino, Sacramento’s supervising building inspector, consulted with an electrical plan reviewer and concluded that PV Hazard Control Systems would be treated as a design choice which is allowed by code.

“Given the fact that the proposed product is UL listed, it would be approved as code compliant,” Bernino said.

Alternative review process in Tampa, Florida

Florida has not yet adopted the 2020 NEC, which includes the UL 3741 standard for PV Hazard Control Systems. The Florida Building Code incorporates the previous 2017 code.

Until Florida adopts the 2020 NEC, JC Hudgison, Tampa’s construction services center manager and chief building official, suggests an alternative. Try an Alternative Means & Method Request (AMMR) to get projects with PV Hazard Control Systems approved.

The AMMR process gives building officials discretion to approve system designs that satisfy and comply with the intent of existing code. Designs must also provide at least an equivalent measure of fire resistance and safety.

Alternative review in Napa County, California, too

The City of Napa’s Building Division issues permits for commercial solar systems. But a senior building inspector, when asked about UL 3741, directed us to inquire with the county Fire Marshall.

Fire Plans Examiner Adam Mone explained that the Fire Marshall’s review would be limited to a comparison of system designs as presented against the 2019 edition of the California Fire Code. Mone encouraged us to talk with Napa County’s Building Division about compliance with the 2019 edition of the California Electrical Code.

We will update this post if we get Napa County’s perspective on UL 3741 PV Hazard Control Systems. UPDATE: According to Interim Chief Building Official Harvey Higgs, Napa will also accept UL 3741 PV Hazard Control Systems as an alternate means until January 1, 2023, when the 2022 edition of the California Electrical Code takes effect and the devices are explicitly allowed by code.

We will post additional responses from other jurisdictions too.

Ask an AHJ

Want our communications team to ask an AHJ in your community about approval for PV Hazard Control Systems? Send a message through our contact page or email us at hello@sepisolar.com.

Also keep an eye on our LinkedIn page. We post daily content for renewable energy professionals, including our new monthly feature: Ask an AHJ.


SepiSolar_Blog-Magazine-featured-image-2022-04.png

May 2, 2022

Forum, the Consumer Attorneys of California’s bimonthly magazine, discusses how engineering expertise can protect the interests of solar project owners in its latest publication. Sepi CEO Joshua Weiner, a member of the Consumer Attorneys of California (CAOC) expert witness referral network, wrote the article.

CAOC is a 61-year-old professional association based in Sacramento. It provides support and continuing legal education for over 3,000 lawyers. CAOC members represent plaintiffs and consumers on a wide range of claims, including those involving product safety and product defects.

Weiner’s article tells the story of a growing issue for property owners who produce solar energy. After installation, these systems do not always generate the expected financial returns. Consumers then wonder if their contractors can or should be held accountable. The article describes a representative case in Southern California that Sepi handled as an expert.


When expectations go unmet

At an RV park with 434.7 kW of solar generating capacity, Sepi found a system that was producing about 93 percent of its expected energy output but only 58 percent of expected year-one cost savings. Technical performance had hit the mark. Financial performance was amiss.

Utility rate tariffs, it turns out, were both the cause and the solution.

The contractor modeled financial performance based on one of many utility rates offered by Southern California Edison (SCE). The interconnection agreement, a contract that gives permission for solar project owners to interconnect with the utility grid, specified a different rate.

A change in net energy metering, which sets out compensation and fees for solar energy supplied to the grid, led SCE to switch the utility rate once again.

Finally, Sepi analyzed SCE’s utility rates and recommended a different rate that would restore most of the lost savings.

Expertise as a service

Sepi’s engineering team provides expertise for three groups of customers: companies creating solar and energy storage projects, companies creating solar and energy storage products, and various professionals, including attorneys, who need consulting services from an industry expert.

Expert witness services are an important part of our work for attorneys, representing both plaintiffs and defense. We fulfill discovery, analysis, and fact finding for projects that result in financial loss, technical failure, or contractual claims. Areas of expertise include project development, construction agreements, energy technologies, policy, finance, codes, and industry standards.

For free access to the entire March/April edition of Forum magazine, including our article on solar expertise for conflict resolution, visit the CAOC Forum 2022 article index.

To learn more about CAOC’s expert witness referral network, go to the CAOC Vendor Directory. Select ‘Expert Witness Referral’ in the ‘Services Provided’ drop-down menu. Leave all other fields blank, and click on the Search button.


Feature photo by Rachel Brown at Spring Green Graphics


engineer-working-with-a-laptop-in-solar-power-station-picture-id1318137489.jpg

December 9, 2021

Putting a project together for the first time? Not sure where to start in the confusing jungle that is energy project development?

You probably have a few questions:

  • Does my project pencil out?
  • Can I connect to the grid?
  • Do I have the right site?

It’s important to resolve these questions sequentially. You’re best off addressing revenue discovery and selecting among technologies and products before approaching site feasibility. And model cash flows before asking for permission to interconnect with the grid.

Working closely with a solar development engineer, someone who can lead an energy project through every stage of development, you get more value than by keeping project development and engineering in silos.

Here’s how a development engineer can help eliminate confusion for new developers.

Does my project pencil out?

Let’s start with the revenue. It has to be high enough to justify the cost and risk of developing a new project. Revenue can come from a variety of sources — utilities, municipalities, ISO markets, aggregators, consumers, to name a few. The revenues available for solar-only projects in saturated markets are dwindling, but energy storage provides a new opportunity for sites that are strategically located.

What about all the various costs that come into a new project? Let’s start with the cost of land. It has to be low enough for your project to make low-cost energy. The assumed cost of a land lease should be about 2.5¢ per Watt per year for utility-scale projects and commercial ground-mount projects, according to the National Renewable Energy Laboratory.

You also need access to capital, someone who will buy the energy you produce, and an interconnection agreement granting permission to connect with the electric grid. That leads us to the next question.

Can I connect to the grid?

Proximity to a load-serving entity also affects the cost of the project. All things being equal, projects sited closer to a utility substation will incur lower interconnection costs. This is important as grid interconnection costs are on the rise in several US regions, including the northeast, the midwest, and the southwest.

The sequence of events has not changed. But solar project developers, especially first-time developers, tend to recognize that the early stages of the process can be tedious, that an interconnection agreement means money, and go straight for the goal. This is a mistake.

Do I have the right site?

Your site is in the desert, not a tree in sight, and gets beautiful sunlight all year long. What’s not to like? Wouldn’t everyone want to buy the energy that your site could produce?

Well, these types of remote locations might bode well for production. But deliverability suffers due to higher costs of transporting energy across long distances to reach the site of consumption. In other words, “more sunlight” doesn’t always mean “more money.”


Why interconnection can’t come first

It’s reasonable to question the status quo. We live in an age of disruption fueled by new ideas. What if you could specialize in the lucrative business of obtaining interconnection agreements and let someone else handle the rest?

Would it be like starting a race halfway to the finish line? Sort of.

But instead of discovering a shortcut, you will find yourself running further, all the way back to the starting line before you can continue along your way.

That’s because of two fundamental laws of project development.

1. Changes upstream require subsequent changes roughly 99 percent of the time.

2. It’s slower and more expensive to do project development out of order. Maybe not always; just about 99 percent of the time.

Any good construction manager will tell you about the need for a detailed geotechnical analysis to understand impacts of soil corrosivity, groundwater, and other subsurface conditions before solidifying an approach to civil engineering and structural design.

Pile driving is expensive. If you overspend on equipment, material, and labor, the impact on project financials will be noticeable. Underspend and the consequences may be ruinous.

Two solar specialists at Burns & McDonnell, a leading EPC firm, have said in a Power Engineering article that change orders stemming from an incomplete geotechnical study “can sometimes result in seven-figure cost differentials.”

Preconstruction activities can also derail a project. Just think what would happen if you designed a solar project and procured equipment on the assumption that you could easily export power to the grid, only to discover that interconnection would require severe limits on power exports?

This is not a hypothetical scenario. It happened.

The solar development engineering process

When a developer first contacts SepiSolar about project engineering, we usually begin by identifying whether plans call for interconnection in front of the meter or behind the meter. The answer helps us know which engineering processes to follow.

If it’s a rooftop solar project connecting behind the meter, there’s no need to explore the most favorable markets and the most feasible sites for development. These decisions are already set in stone. Operating within the given constraints, we can tell you how to maximize system size and begin to model project cash flows accordingly.

Behind-the-meter projects benefit from streamlined engineering. Front-of-the-meter projects go through SepiSolar’s development engineering process.

You invest more time upfront. But instead of hoping your basic assumptions are correct—Interconnection via PJM, Midcontinent ISO, or Southwest Power Pool? Solar only or solar-plus-storage?—you’ll use data to make the right decisions.

Development engineering follows a six-step process based on a chronological series of questions each project needs to answer.

Solar development engineering questions

Revenue

1. First, what type of system should we build? Policy research, tariff research, and incentive research help decide whether you can make more money with solar, solar-plus-storage, or neither.

Right now in California, solar has a 14- to 15-year payback period. If you’re focused on developing projects in California, plan to build solar with batteries.

Technology

2. Once you know the type of system to build, it’s time to narrow down the options by technology, vendor, and product. If batteries are part of the equation, should they be lithium batteries or flow batteries? How to select from a multitude of module and inverter options?

A development engineer will perform due diligence looking at bankability studies, warranty analyses, and more to recommend the least cost/best fit alternatives for your project.

Feasibility

3. Next, let’s look at your site. Is it in a swamp? In extreme wind, could it blow away? Answers from your completed feasibility study will identify what you can build on the property, site constraints, and what hoops you’ll have to jump through.

Solar developers sometimes try to bypass the initial questions and begin with cash flow modeling, but this often leads us back to that very first question: Where’s the money?

Modeling

4. With cash flow modeling and system sizing, you will know for the first time how much money a project can make. This is a magical moment, a point where developers make go/no go decisions on large-scale projects. Are the decisions based in fact or fiction? That depends on the analysis that came beforehand.

Design

5. Assuming you have decided to go forward with development, the next question is, where to place the equipment based on property setbacks and easements, the location of access roads, staging areas, and electrical equipment? The answers produce the details needed for a conceptual design that you’ll need to submit to the authority having jurisdiction (AHJ) and the utility.

Interconnection

6. Finally, what are the local requirements for permitting and interconnection approval? Once you satisfy these requirements, at last, it’s time to think about the start of construction.

Talk to us about development engineering

As the solar and energy storage industries have grown, the development engineering process has stayed largely the same. The underlying value comes in two parts.

First, the ability to stick with the process. There’s always pressure to move faster through solar project development. It can be tempting to accept someone else’s word about site feasibility. A good development engineering team will independently verify the risks itself.

Second, the ability to keep up with rapid changes that affect the types of projects to develop and where to build them. Policies and tariffs may shift from year to year, even quarter to quarter. Product research next year will look quite a bit different than the due diligence you performed a year ago.

Visit the SepiSolar development engineering service page to learn more about how we can support your utility-scale projects and commercial ground-mount projects and to get in touch with our team.


wim-arys-gDlpMyInsak-unsplash.jpg

September 16, 2021

It might seem counterintuitive but it’s true. If you want to save time and money by avoiding change orders on your solar and energy storage projects, spend some time and money on value engineering before you get too far down the road.

Trial lawyers know how this works. Get all the facts up front so there are no surprises when the time comes to stand before a judge and jury. A good lawyer is more than an advocate. A good lawyer performs a detailed investigation, assesses risk, and works to achieve the best possible outcome.

The same is true about a good project engineer. When you’re building solar and energy storage projects, the authority having jurisdiction (AHJ) serves as the judge. The construction crew is the jury. And the engineer who reviews all the technical data and asks all the necessary questions will make the most convincing case for permitting approval.

A structured and repeatable process is important. So is the quality of communication between the contractor and the engineering and design team. And never underestimate the value of experience. Nobody can see into the future, but experience guides us to the right questions to ask and the permitting pitfalls to avoid.

Knowing that, we’ve asked three of SepiSolar’s most experienced engineers to share some tips on how they guard against project delays and surprise budget jumps. Change orders late in the planning process can lead to unhappy project owners and can compromise bids on future projects.

Here are three steps to avoiding change orders from SepiSolar development engineer Taylor Bohlen, design engineer Ryan Mateo, and operations project manager Dylan Brown.


Next-level detail in the site survey

It’s all about the level of detail in the site survey, Bohlen says. The site survey lays the groundwork for potential issues to be caught up front so that they can be accurately estimated and dealt with before the project moves forward to a point where engineering revisions will be needed.

It can also help to verify layout and equipment spacings in the field instead of accepting what you see in off-the-shelf solar design software assumptions. Assumptions baked into the proposal generating process might not align precisely with the reality at the project site. These discrepancies can result in change orders.

Here’s a checklist SepiSolar uses to generate the most comprehensive dataset for commercial and industrial projects and utility-scale projects.

The engineer will evaluate site survey details procedurally at the beginning of a project in context of the final system and its objectives. Structural information will go to a structural engineer for analysis up front. Feasibility of the physical layout will drive decisions related to electrical layout.

Each step of the design process determines feasibility in the steps that follow.

Ripple effects from design changes

There’s a misconception out there about the impact of seemingly small changes in project design, Mateo says. Consider what happens with one of the more common changes, swapping one type of solar module for another.

Contractors often recommend one type of module during the sales process but then find its unavailable. You might find another module that costs about the same and has the same power class but slightly higher short-circuit current rating.

Does that seem like a miniscule change? It can sometimes make or break your ability to run parallel strings in an inverter maximum power point tracker (MPPT).

If you can’t run parallel strings and you don’t have enough inputs in the selected inverter, the module swap can lead to an inverter swap. That’s more than a ripple. It’s a tidal wave.

Every input in project design affects something else. Contractors should work with designers to finalize aspects of the project starting with least dependent portions and moving up to the most dependent.

Finalize layout before moving to wire diagrams. If you remove modules because the roof could not handle the weight, the electrical calculations have changed.

SepiSolar’s milestone process, commonly used in the construction industry, reduces the amount of change orders we see.

Know agreements like the back of your hand

All parties need to understand what’s involved with a project, from timelines to equipment to subcontractor roles. These details should be well defined before project execution, says Brown.

When site owners ask questions about items that are outlined in the project brief, that’s a change order red flag.

If multiple contractors are involved in a project, is it clear who’s responsible for each aspect of the project? Every structural, electrical, or civil detail should be accounted for.

Resist pressure to advance to the next project milestone without obtaining stakeholder approval. Contractors may get pressure from site owners, financiers, even your own boss. If you need a cautionary tale, see what happened when SepiSolar was brought in to re-engineer a project that was initially built for power to flow in one direction and then had to accommodate bidirectional distribution.

The need for re-engineering was an avoidable mistake caused by confusion about who would file an interconnection agreement.

Avoiding change orders is risk management

If you have completed all three steps to avoiding change orders—producing a detailed site survey, recognizing the ripple effects from design changes, and mastering the finer points of your agreements—you’re well on your way to a successful outcome.

For more ideas, download our C&I Risk Management Guide. We put together the guide as a resource to help contractors get consistent, repeatable project planning without surprise bottlenecks, permitting delays, and escalating costs.

There are no practice rounds in project management. You need to know that designs are always accurate and error free. Find out how in the risk management guide.


SEPI_Blog_Weight.jpg

August 6, 2021

In a recent analysis of energy storage test results, SepiSolar engineers Taylor Bohlen and Richard Dobbins noted the shortcomings of system availability as a measure of long-term performance.

System availability quantifies the percentage of time that a storage unit has been operating. If a system stays online, charging and discharging power for 750 hours during a period of 1,000 hours, system availability is 75 percent.

Do you want to know how well the system is performing while it’s online? Or the impacts that product failure events have on performance? These questions are critical for energy users, system operators, and grid managers. But system availability doesn’t answer them, and we don’t want to sift through archives of data to find the answer.

So the SepiSolar engineering team got together and created a metric that does. We adjusted the definition of availability, so it’s weighted by the operational capacity of the system, giving us the battery’s weighted availability.

Weighted availability is the missing piece of the puzzle. It’s one number that takes into account several different aspects of availability and reliability, including mean time between failure (MTBF) and mean time to repair (MTTR). You could also call it average discharge capacity or average functional capacity.

Weighted availability provides a quick snapshot of how an energy storage system is going to perform long term. And it allows comparisons across energy storage products of all types, such as lithium, flow, and flywheels.

This post will show you how to calculate weighted availability for any time interval. We hope this improves your independent engineering evaluations for purchasing, warranties, system design and more.


The weighted availability difference

Availability by itself means practically nothing. A system can be on nearly all the time, but if it’s performing suboptimally when it is on, availability can mask real issues with the system. By the same token, for a system that’s on for a little less time but performs always at peak capacity, availability can understate how well the system performs.

One battery system in our analysis really drove home the importance of digging deeper into availability and reliability. With system availability at almost 87 percent, this battery appeared to be one of the best-performing units in the lab. But the performance history told a different story.

Since March 2020, the battery manufacturer has suspended maintenance due to COVID-19, with components that appeared to be nearing the end of their service life. The manufacturer limited cycling depth to prevent battery damage and maintained a limited cycling profile through October 2020.

Inverter failures in 2018 and 2019 also contributed to reductions in energy dispatch until the manufacturer completed inverter replacements and upgrades in May 2019.

For all the time that this battery curtailed cycling and limited energy output, the system was operational. There was no impact on system availability, but weighted availability was reduced at times by one-third or two-thirds due to inverter failure. The error and the impact of the error are captured in weighted availability.

To drill deeper and understand why weighted availability was getting pushed down, see MTTR, the average time needed to restore the unit to full operational capacity after a failure event. In this case, MTTR was nearly 86 days.

When independent engineers evaluate batteries, we look at how operational characteristics affect risk-adjusted value. One system might increase performance but also increase the need for maintenance. Another system providing less energy might reduce downtime and maintenance costs.

We created the weighted availability metric to show a more complete picture of the use and lifecycle of each battery unit.

Calculating weighted availability

Here’s the formula for availability where Operational Time means a unit of time where battery operational capacity is greater than 0, and T equals total installation lifetime, or time since the beginning of an initial battery cycle.

Now, here’s the formula for weighted availability.

Instead of measuring when the system is operational, weighted availability calculates available power at each measure of time and divides it by the system’s nominal power.

For the best analysis, look at weighted availability along with all the other metrics. If you’re designing residential storage systems to keep the lights on and small electronics charged during intermittent breaks in utility service, availability might still be the most useful metric. If you’re developing microgrids with complex storage needs, weighted availability can help you decide whether to accept suboptimal performance or dispatch a maintenance crew.

Better yet, look at multiple metrics in tandem. If you have a battery with 99 percent availability and 90 percent average discharge capacity, you can know that the system will be available nearly all the time and, of the time the system is operational, you can expect it’ll be performing at 90 percent of its rating over the long term. That’s more than you’d know if you had only one metric to work with.

Solar sabermetrics

The movie Moneyball, released in 2011, tells the true story of how a small-market baseball team used sabermetrics—essentially, baseball statistics—to compete with the big boys.

Old-school talent evaluators used subjective criteria to identify which players were destined for stardom. Attitude. Perceived confidence. The shape of the jaw. They also used simple performance metrics like batting average, the ratio of hits to total times at bat.

Through quantitative analysis, some teams realized that swagger and batting average have little meaning. As a better predictor of success, they looked at two metrics, on-base percentage and slugging percent, and added them together.

On-base percentage is the ratio of hits and walks to total times at bat. Slugging percentage is a weighted measure of hits to at-bats with extra weight ascribed to doubles (two-base hits), triples (three-base hits), and home runs (four-base hits).

If the weighted average of battery systems becomes a standard metric, it will help improve our understanding of energy storage like sabermetrics improved our understanding of baseball.


Feature photo by Victor Freitas on Unsplash


los-angeles-skyline-at-dawn-panorama-and-griffith-park-observatory-in-picture-id946237092.jpg

July 8, 2021

State of market

California has an enormous need to bring new energy storage capacity on the grid, especially for commercial and industrial (C&I) energy users. As you’ll see below, the project pipeline reflects the need. However, procurements and interconnections are not keeping up with demand.

Pipeline

37,040 MW solar+storage projects in the Cal ISO interconnection queue, as of June 2021

15,115 MW stand-alone energy storage projects in the Cal ISO queue

Procurements

4,189 MW energy storage procured, according to California Energy Storage Alliance

250 MW behind-the-meter energy storage procured

Interconnections


Key barriers to growth

What’s standing in the way of market growth for C&I energy storage in California? A little bit of everything. Although California is a market leader, it takes longer to complete project permitting than in other states, like Florida and Nevada. Interconnection costs are higher, too. One way to make utility rates more energy storage-friendly would be to shift from monthly demand charges to daily demand charges, as described below.

Permitting

Median inspection times for on-site commercial-scale energy projects in California are slow, according to solar data collected by the National Renewable Energy Laboratory. The wait time tends to be 19.5 days. This contributes to a wait time of nearly 3 months overall for permitting, interconnection, and inspection. California can speed up inspection times.

Interconnection

Many utilities in California and around the country require no fee to apply for interconnection for on-site energy projects. The investor-owned utilities in California are different. PG&E customers pay an interconnection fee of $145. San Diego Gas & Electric customers pay a $132 fee. Southern California Edison customers pay a $75 fee. California can eliminate interconnection fees.

Utility rate design

In November 2019, PG&E introduced commercial rate tariffs with daily demand charges, becoming the first utility in California to do so, according to the California Solar + Storage Association. Instead of collecting demand charges based on the highest single interval of demand in the monthly billing cycle, PG&E’s new approach assesses charges according to the highest level of demand within set periods each day. For system operators, this offsets the risk of unpredictable demand charges and the need for risk mitigation.

When PG&E introduced daily demand charges, California regulators limited participation to 50 MW of storage for each rate tariff offering daily demand charges, or 150 MW overall. Regulators should make daily demand charges the norm in California and make sure they are accessible to commercial customers throughout the state.

Solution

In 2019, California regulators gave operators of solar-plus-storage projects an opportunity for the first time to export battery power onto the grid and receive net energy metering (NEM) credits for the output. NEM for storage has huge implications for the market, as we explained in a recent blog post.

  • NEM for storage eliminates the need for expensive meters, relays, and switchgear.
  • It simplifies design for solar-plus-storage systems.
  • And it builds consensus around the value of distributed energy resources at a time when legislators and utilities are pushing hard to undercut NEM for solar.

Featured project

For a Riverside County office building, SepiSolar Chief Electrical Engineer Richard Dobbins designed a 694.9 kW array of solar canopies to cover the parking lot and an 87 kW, 193.5 kWh battery energy storage system for an enclosure at the edge of the property. See our solar and storage design examples page to download the project’s site plan, three-line diagram, parts list and more.


Have a C&I solar project of your own?

If you have a C&I solar project and need some design and engineering expertise, don’t hesitate to contact us for help. Simply click below, provide some details about your project and we will follow up promptly to discuss it with you.

CA Small Business Enterprise

Certification ID:
2015743

Bidder/Supplier ID:
BID0068933

NAICS Codes:
541330 – Engineering services
541340 – Drafting services
541490 – Other specialized design services
541618 – Other management consulting services
541690 – Other scientific and technical consulting services
541990 – All other professional, scientific, and technical services

D-U-N-S number:
065817064
CAGE:
8F5K7

UNSPSC Code:
811024, 81101701, 81101516, 81101604, 43232614, 81101505


Subscribe to the SepiSolar newsletter:


Subscribe Now