EnergyStorageSystem-1200x799.jpg

August 5, 2019

This post was written by Josh Weiner, Solar Expert Witness & Solar Engineering Expert. Mr. Weiner has been at the forefront of the solar energy industry for over 20 years and is an industry leader on solar-plus-storage engineering & design. Josh’s expertise spans both in-front of and behind-the-meter initiatives including residential, commercial, utility, grid-scale, and ev charging solar and storage applications. 

Lithium battery safety is not rocket science. Manufacturers with a robust set of production data can show customers success rates for their batteries and the conditions that cause batteries to fail. The problem is that very little safety data is accessible to most buyers or the public.

Buyers will always have to decide for themselves how much risk they are willing to tolerate. Some source batteries from a selective group of original equipment manufacturers (OEMs) and pay a premium to avert risks associated with the lowest-priced batteries. But many buyers are operating in the dark, lacking the safety data they would need to make an informed decision.

Consequently, the energy storage industry in its brief history has already witnessed dangerous and damaging lithium battery safety incidents, including the April 19 fire at Arizona Public Service’s McMicken Energy Storage facility. Other notable incidents include a lithium battery fire and subsequent battery malfunction that led the Federal Aviation Administration in 2013 to ground Boeing’s entire 787 Dreamliner fleet. The next lithium battery fire can happen almost anywhere, anytime.

To safeguard against fire risks, ask lithium battery makers the questions about cell production and testing in this post. Battery buyers don’t have to wait for technology development or new regulations. They can bring about a new safety standard by demanding better safety data and buying lithium batteries only from OEMs that make the data available.

Questions to ask about cell production

Some online shoppers go to commerce platforms like Kickstarter for innovative products and products that may be available at a significant discount from an upstart manufacturer. When sourcing lithium batteries, you want to take the opposite approach. Instead of pursuing innovative products, look for proven products that have a long track record of consistent production. Instead of hunting for discounts from unknown suppliers, expect to pay fair value for a product that has completed a rigorous safety analysis and achieved an exceptionally low failure rate.

How many battery cells and battery packs does your supplier produce each year?

One lithium cell represents one data point. The more cells you produce, the more data you have. As such, the highest-volume producers have the most data on performance, thermal runaway, and failure.

For this reason, an OEM producing 10 million cells per year should have a better understanding of cell safety and performance. Large-volume manufacturers have probably seen every possible failure occur many times. By the same token, a small-volume manufacturer needs more time to analyze and understand cell failure. Buying cells from small-volume manufacturers may carry more risk.

What changes have been made to the battery cell and battery pack production process?

A consistent manufacturing process yields predictable safety and performance results. It’s plain to see that different cell materials bring about different cells. But different production equipment can affect safety characteristics just as much. Even if the materials and equipment stay the same, a manufacturer that relocates production may alter a host of environmental conditions and other variables that affect results. Changes in relative humidity, temperature range, and impurities in the air can impact safety characteristics of lithium cells. Differences in quality control and other processes introduced by a new manufacturing technician crew can also have an effect. All these changes should be understood and quantified in a prudent lithium battery safety analysis.

How does your supplier handle material acceptance and storage?

Even if everything goes right during the manufacturing process, pre-production material acceptance and storage can affect lithium battery safety. About five years ago, a global supplier of solar inverters experienced a series of product failures after electronic circuit boards had been stored in the wrong warehouse and exposed to moisture. Once product assembly was complete and the inverters were energized, a short circuit on the boards caused a fire and led to quite a bit of property damage. While moisture can also affect battery cell safety, so can other environmental conditions, such as air impurities and particulate matter.

It’s not easy to perform a safety analysis that identifies failure points for battery cells. To test how moisture affects safety, you would have to take identical cells and store one of the cell materials in an environment that gets wetter in small increments until you find a statistically relevant number of failures. Then you would have to repeat the process with incremental changes in temperature, dust, and other variables. Testing would require a lot of cells, a lot of minor changes in cell processing, a lot of time, and a lot of analysis. And it would all have to be done without vastly increasing cell production costs.

What are the failure rates for your supplier’s battery cells and battery packs?

In the absence of industry-wide standards, contractors seeking assurances about product safety have their work cut out for them. First, they have to request failure rates and analysis from each of their suppliers. Then the manufacturers must provide the data. Next comes the subjective test. If the contractor feels comfortable with the risk, he or she can decide if the battery quality is adequate. Different contractors have different tolerance levels for quality. A contractor who installs one small system per year may not place a great deal of emphasis on quality. The chances of failure are small. However, contractors installing many large systems must pay more attention to quality. Their businesses depend on the successful operation of a much larger population of cells.

Consider an OEM with a 99.98 percent success rate for battery cells in the first three years of operation. That translates to a 0.02 percent failure rate. If a contractor installs 1,000,000 cells per year, the contractor can expect 600 cells to fail. [Multiply failure rate (0.0002) x annual production (1,000,000) x number of years (3).] This might be an unacceptable level of risk. On the other hand, if a contractor installs 10,000 cells per year, the contractor can expect 6 cells to fail. This level of risk might be no big deal, so long as those cell failures don’t propagate to the entire pack or the entire storage system.

Questions to ask about cell testing

We all know not to leave a fireplace unattended or a gas oven running when nobody’s home. We understand that doing so introduces a serious risk of fire. But how many people know the temperature threshold that is likely to cause a lithium battery to catch fire or explode? Before procuring lithium batteries, especially those that will be sited at a building where people live or work, be sure to understand the conditions that create lithium battery safety hazards. Safety hazards that start in a single battery cell can quickly spread to the battery pack and the entire energy storage system.

What are your supplier’s battery cell thermal runaway characteristics?

It’s important to understand how a battery cell responds to the conditions that can initiate a fire or an explosion. There are many ways to test lithium cells for these conditions. Some examples are the top nail test, where a nail of standard size is driven with standard force into the top of the battery, and the side nail test, where the same procedure is carried out with a battery lying on its side.

Other tests include the fast heat test, where a battery inside a control chamber is exposed to a rapid temperature increase; the slow heat test, where a battery is exposed to a slow temperature increase, and the overcharge test, where a fully charged battery stays connected to a power source and is continually charged.

What is the probability of thermal runaway for your battery cells?

With test results in hand, you can make reasonable predictions about how a battery will perform according to design specifications. Graph 1 shows how increased temperature leads to thermal runaway. While all five cells exhibit similar power generation as temperature increases, there is a notable difference in how close each cell comes to the failure point represented by the horizontal red line at 160°.
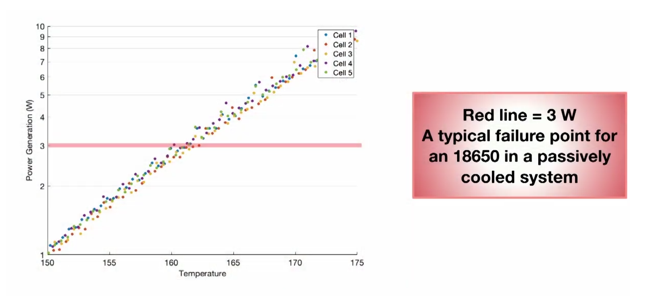
how increased temperature leads to battery cell thermal runaway

Graph 1

Graph 2 shows how constant temperature over time leads to thermal runaway. The battery cell depicted by this graph remains at very low risk of thermal runaway when temperature is held constant at 159°. But a 1° increase in constant temperature vastly increases the probability of thermal runaway. A 2° increase makes thermal runaway a near certainty.
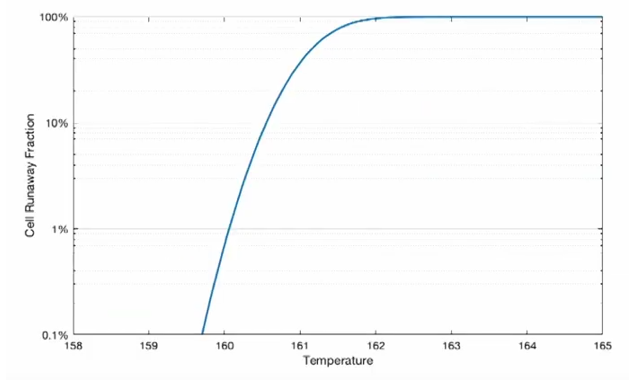
how constant temperature over time leads to battery cell thermal runaway

Graph 2

One of the challenges when characterizing lithium cell failure is calculating at what temperature and over what duration a cell fails. Because the answer is different for each cell, we need to see how different the answers are. What if one cell failed after two hours at 60°, another cell failed after 5 hours at 190°, and a third cell failed after 3 hours at 250°? This data would be difficult to characterize. It seems like almost every temperature is dangerous and could lead to cell failure.

Now what if the data looked more like this? Cell 1 fails after two hours at 160°, Cell 2 fails after two hours at 161°, and Cell 3 fails after 1.5 hours at 162°. This data suggests that thermal runaway is consistent and predictable. If we can find consistent results, we know when failures occur and how to prevent failure by designing systems for lithium battery safety.

How does thermal runaway spread from cell to cell?

This is really a two-part question. For starters, let’s look at how thermal energy from a failed lithium cell gets distributed across neighboring cells. Do all neighboring cells get the same amount of energy from the failed cell? Does one cell get all the energy while the others get none? Do two cells get 90 percent of the energy? Next, let’s look at how much stress an initiator cell applies on neighboring cells. If a failed cell exposes neighboring cells to temperatures up to 120°, the risk of cell-to-cell propagation is low. The risk is much higher if a cell failure has a magnitude of 180°. If energy is distributed unevenly, we would want to know the magnitude of stress for each of the neighboring cells.

What are the conditions that lead an entire battery pack to catch fire?

If cell-to-cell propagation extends to one or two neighboring cells and stops, failure of the whole battery pack or battery module is unlikely. If cell-to-cell propagation extends to hundreds of neighboring cells, it’s far more likely that the entire pack will burn. By understanding when battery packs catch on fire and start heating up the neighboring packs, the system designer can plan for fire detection and suppression systems as required by NFPA 855 and UL 9540A to kick in as a last line of defense.

What are the conditions that lead an entire energy storage system to catch fire?

If a fire containment system fails to contain a fire within the energy storage system enclosure, the charging infrastructure for the batteries may also catch on fire. (Think of a car catching on fire while being pumped with fuel at the gas station. Fire can spread to the gas pump, then the entire gas station.) Once the charging infrastructure is on fire, the entire property, including its occupants, are at risk. In sum, one battery cell failure can lead to the destruction of an entire building and the loss of life.

Demand lithium battery safety data

A safe battery is a well-documented battery. Test data helps engineers, system integrators, system owners, and regulators make smart, effective business decisions. While data doesn’t eliminate risk, it does inform us of the risk. Therefore, data empowers us to make decisions on how to manage, contain, suppress, mitigate, or ignore it. By putting appropriate measures in place, we can reduce risk to an industry-acceptable level. Without test data, a battery might operate safely today, but we don’t know why. Then if conditions change and the battery is no longer safe, we won’t know how to mitigate the risk.

The industry can expect a steady supply of safe lithium batteries as soon as buyers make purchasing decisions conditional on access to safety data. There are many safe batteries on the market. But there are many more cheap, risky batteries on the market. The simple solution is to buy safe batteries—which might mean accepting a higher price.

Contractors should request data from OEMs or look for third-party evaluations from independent engineering (IE) reports or independent test laboratories. The data is not publicly available, or hard to find, which is a serious problem. UL, the “gold standard” in product safety, even has trouble gaining access to this sort of data. So one requirement in the UL 9540 standard is to capture thermal runaway data, even for batteries that pass all the tests. In other words, when a lithium battery goes for the UL 9540 test, the test lab will force the battery into thermal runaway and then document the results to help characterize lithium cell failure.

nathan-dumlao-LPRrEJU2GbQ-unsplash-1200x800.jpg

July 22, 2019

This post was written by Josh Weiner, Solar Expert Witness & Solar Industry Expert. Mr. Weiner has been at the forefront of the solar energy industry for over 20 years and is an industry leader on solar-plus-storage engineering & design. Josh’s expertise spans both in-front of and behind-the-meter initiatives including residential, commercial, utility, grid-scale, and ev charging solar and storage applications. 

We’ve seen this movie before. In 2008, project developers in the US prepared for the sunset of the 30 percent federal investment tax credit (ITC), a key source of financing for solar projects of all sizes. Urged on by industry lobbyists, Congress passed legislation extending the tax credit, and President George W. Bush signed it.

In 2016, the ITC was again due to expire. Congress and President Barack Obama gave the tax credit new life, preserving its 30 percent value until the end of 2019. In addition, they established a gradual step down over three years. In 2022, the credit settles at 10 percent for commercial and utility-scale projects. For residential projects, the credit goes away.

As the industry rallies to defend the ITC, this might look like the opening scenes of another sequel. But there’s no guarantee that the story concludes with the same happy ending.

With less than six months till the end of the year, let’s mobilize for the best possible outcome. But let’s also be prepared for expiration of the 30 percent ITC. After all, the tax code, under a mechanism known as the safe harbor provision, allows qualifying projects to preserve the full value of the 30 percent credit as projects advance through the development lifecycle, including projects that come online in 2020 and beyond.

A design and engineering firm can provide crucial assistance as the clock winds down on the 30 percent ITC. Because our services can help qualify projects for safe harbor, developers and EPCs working with SepiSolar can create value while taking steps to show that a project has commenced construction for federal tax purposes.

A specialized firm can also share knowledge about securing tax credits for solar and storage projects and maintaining eligibility throughout the project lifecycle.

Value creation for projects

When a developer engages an engineering firm to begin processing interconnection agreements, perform feasibility studies, and obtain PE stamps for project plan sets, this work buys valuable time for projects to mature.

The benefits to the developer are twofold. Project design work can help keep the 30 percent tax credit in play even after the calendar turns to January 2020. It also creates an opportunity to smooth workflow. Instead of hustling to complete projects in December, developers can start scheduling for the start-of-year “slow season.”

EPCs also benefit by increasing projected revenue. What’s good for the developer is good for the nimble EPC.

While evaluating tax equity for solar projects, consider opportunities to claim the fuel cell ITC for stand-alone storage projects. Vanadium flow batteries qualify because charging and discharging happens in an aqueous state through an embedded fuel cell. The process of preserving the 30 percent ITC is the same for qualified fuel cells as for solar projects.

In addition, SepiSolar can help design solar-plus-storage projects to optimize tax credits for different project risk profiles. To qualify for the ITC, a renewable energy source must supply more than 75 percent of energy to the battery.

In an AC-coupled configuration, electrons must be “counted” and “measured and verified” each time they’re generated and sent to a battery. Depending on generating capacity, storage capacity, and the project use case, it may be difficult to meet the 75 percent rule, thereby putting the tax credit at risk.

In some cases, it might be better to switch to DC-coupling for tighter control of ITC compliance. In a DC-coupled configuration, a project can ensure that all energy to the battery comes from PV and none from the grid. This would not only comply with ITC but maximize it.

Applying for ITC safe harbor

There are two ways to preserve eligibility for the 30 percent ITC under the tax code’s safe harbor provision. A project can start physical work, or it can incur 5 percent of an energy property’s total cost.

Design and engineering generally does not meet the conditions of the physical work test. But these services can be included in the 5 percent safe harbor test. As noted in a 2018 advisory from the IRS:

Construction of energy property will be considered as having begun if: (1) a taxpayer pays or incurs five percent or more of the total cost of the energy property, and (2) thereafter, the taxpayer makes continuous efforts to advance towards completion of the energy property.

To satisfy the continuity requirement over the months and years to come, projects can pay additional amounts toward the total cost, enter into binding contracts to produce project components or the project itself, obtain project permits, or perform physical work on the project.

Consult a licensed tax advisor with questions about how to apply provisions of the tax code to specific projects.

Engineering for safe harbor

Design and engineering services that help a project qualify for safe harbor under the 30 percent ITC can quickly pay for themselves. After all, the difference between a 30 percent credit and the 26 percent credit that kicks in on January 1, 2020, may be greater than the total cost of design and engineering, especially for commercial and industrial projects.

For instance, consider a 500 kW flat-roof solar project with an all-in cost of $1.50 per Watt.

Project cost

$750,000

30 percent ITC (2019)

$225,000

26 percent ITC (2020)

$195,000

ITC difference

$30,000

Estimated design and engineering fee

$15,000

Estimated savings

$15,000

Contact SepiSolar to find out how we can help secure safe harbor for solar and storage projects, extending development and EPC activities past the busy end of year and into the normally quiet early months of the new year.

solar-design-tool-calculator-1200x800.jpg

June 3, 2019

This post was written by Josh Weiner, Solar Expert Witness & Solar Engineering Expert. Mr. Weiner has been at the forefront of the solar energy industry for over 20 years and is an industry leader on solar-plus-storage design. Josh’s expertise spans both in-front of and behind-the-meter initiatives including residential, commercial, utility, grid-scale, and ev charging solar and storage applications. 

SepiSolar project engineers use one powerful solar design tool to perform many system design functions. Some are completed in minutes. Others take hours. This points to a perennial challenge we face as a customer service organization committed to continual improvement.

When all support requests go into a single queue, quick and easy tasks don’t always get resolved quickly enough.

The fact is, our solar design tool is necessarily complex for highly trained engineers working through a streamlined process. But if you separate the pieces, you’ll find several user-friendly tools that contractors can use themselves. A wire size calculator and a string configuration calculator, for example.

Later this year, SepiSolar will provide six web tools for contractors to perform quick and easy design tasks. Our engineers will continue to handle any project design changes, or all of them if you’d like. We are always available with a wide variety of customer support resources. This is just one opportunity, when the cost of waiting for support on a simple design change exceeds the benefit, for SepiSolar to empower our customers to use some of our solar design tools yourself.

When to use our design tools

Each time a change request comes in to SepiSolar, an assistant project manager or operations manager tags it according to priority, complexity, time needed, and root cause. Tickets go into queue for the engineering team sorted by priority.

If a contractor submits a support ticket to resize a run of wire estimated to be 100 feet but later measured at closer to 200 feet, the complexity and time required would be set to “low.” The same might be true for a contractor wanting to move an inverter from inside a building to a location outdoors, who needs to know if the wire size must change.

Using SepiSolar’s wire size calculator, you enter inputs such as current through the conductor, number of wires in the conduit, and the project site’s maximum ambient temperature. The calculator auto-populates electrical resistance and generates the wire size that you need.

When there’s no urgency, let SepiSolar run the calculation. On the other hand, if you’re in the field and a quick calculation can prevent a return trip to the project site, direct access to our wire size tool can save time and money, eliminating a costly truck roll.

Complex and time-consuming design changes will continue to go directly to the engineering team. For example, an EPC might want to replace 60-cell modules with 72-cell modules in the plan set for an 850 kW agricultural project. Our engineers would use the new module specifications to recheck wire sizes and overcurrent protection and redraw the module array as needed.

If an EPC wants to replace central inverters with string inverters, in order to optimize the project for cost, then instead of using these calculator tools, our engineers would begin a consultation to help with inverter selection, AC wiring design, and DC wiring design, which is what creative, solutions-focused designers do best.

DIY solar design tools

The solar design tools that SepiSolar will make accessible to our customers on the web are simple and user friendly. These tools are not revolutionary. They just make a contractor’s job a little easier, one day at a time. Here’s how they work.

Wire sizing calculator

Oversizing electrical wire means overspending on materials, given the current that will flow through the system. To undersize means the system is carrying so much current that you risk melting conductor wire or insulation. Correct wire sizing avoids both extremes based on conductor material (copper or aluminum), current through the conductor, environment (in conduit, direct buried, or open air), how many conductors in conduit, insulation type (THHN, THWN-2, USE-2, XHHW), and ambient temperature plus adders for the environment.

String sizing calculator

Module string configuration introduces another set of tradeoffs. If you connect too many modules in series, the system can exceed an inverter’s maximum input voltage, causing equipment damage. Connect too few modules and you might fall short of the minimum input voltage required to start up the inverter. To determine string configuration, look at your solar module datasheet and input the following data points into the SepiSolar calculator: solar module manufacturer, model name or number, and quantity; inverter manufacturer and model name or number; racking type (e.g., flush or tilted roof mount, ground mount); maximum, minimum, and average high and average low temperature at the project location.

Conduit sizing calculator

The National Electrical Code limits how much wiring can go inside a conduit. It does so to control heat gain, manage risk of wire damage, and preserve space to eventually add more wires. In the NEC, you can find fill tables for frequently used wire and conduit types and equations for any application. Or input wire and conduit specifications into our conduit sizing calculator to get a fast and dependable conduit size.

120% rule

The 120 percent rule refers to a simple calculation used to confirm that the size of an electrical distribution panel in a home or business facility is large enough to handle the capacity of the circuit breakers feeding it. Most of these residential electrical panels have a 100 amp or 200 amp main breaker. For solar projects interconnected on the customer side of the meter, the National Electrical Code allows total ampacity from all sources up to 120 percent of the busbar or conductor rating. Why? In brief, it’s because when you connect a supply source to the service panel, it has the opposite effect of connecting a load source to the service panel. Instead of reducing capacity on the busbar, the solar generator actually increases capacity.

Voltage drop calculator

Voltage drop is a measure of efficiency in an electrical circuit. A 1 percent drop in voltage equals a 1 percent power reduction at the end of the line. Electrical calculator programs are generally available, but they don’t always consider all solar project inputs, as noted in Solar Pro. (See Issue 3.2, ‘Voltage drop in PV systems’) To calculate voltage drop, input circuit type: AC (1-phase or 3-phase) or DC, nominal voltage, current, wire gauge and material (aluminum vs copper), and the length of your conductor run.

Load calculator (structural and electrical)

Before issuing project permits, local authorities will compare system specifications to the electrical load and structural load requirements on site. Using SepiSolar’s load calculator, customers can size a building’s electrical service capacity based on service voltage (1-phase or 3-phase) and the sum of all motor loads, continuous loads, and non-continuous loads. To generate structural load limits, customers can also enter module weight and quantity, the number of modules racked in portrait and landscape, racking rail weight, rack type (tilt up or flush mount), weight adders (microinverters, optimizers, ballast blocks), and a measurement of wind exposure, such as wind speed, exposure zone, or the mean height of the roof.

Unlike other design tools

Contractors looking for solar design tools will find a variety of options on the market. Some products generate project proposals for use in the sales process along with plan sets for permitting and interconnection. Others require experience with sophisticated CAD software.

SepiSolar’s user-friendly tools are relatively simple in comparison. These are calculators used by licensed engineers, governed by codes and standards that protect public health and safety. They do not take the place of a licensed engineer. They complement the engineer’s work, empowering contractors to make code-compliant calculations yourself and increasing the value of the SepiSolar service.

Home-page-thumb2.png

January 15, 2019 0

This post was written by Josh Weiner, Solar Expert Witness & Solar Engineering Expert. Mr. Weiner has been at the forefront of the solar energy industry for over 20 years and is an industry leader on solar-plus-storage engineering & design. Josh’s expertise spans both in-front of and behind-the-meter initiatives including residential, commercial, utility, grid-scale, and ev charging solar and storage applications. 

Welcome to the new SepiSolar website. Here’s how we listened to you. 


If you’ve ever been to SepiSolar.com for design and engineering services, you’ve probably just noticed that our website has changed–a lot.

Why did we redesign our website? Because we listened to you, our customers and potential customers, who wanted a better user experience. With that in mind, here’s a brief tour of the new SepiSolar website with some highlights of what’s changed.

Better Navigation

We’ve heard from you that extra clicks mean extra time finding the exact design and engineering services that you want. To improve navigation and user experience, we made all of our core services visible on the home page. With one click, you can now learn more about, say, our commercial design services,  or energy storage. The home page also has direct links to information about or our various technical consulting services, administrative services, and SepiAcademy, our new online training platform.


Still can’t find what you’re looking for? Use our search windows at the very top and in the blue footer of the website.

More Resources

SepiSolar website visitors often never knew they could download sample designs, site survey checklists, and more. To make these assets more visible, we now have “Resources” on our main navigation bar. There you’ll discover that we’ve added utility and microgrid design examples, as well as find pages for SepiSolar case studies, white papers and finished project photographs.


More Personal

As you’ll see in our About page, SepiSolar’s mission is “to build a community of designers who care about solving tomorrow’s energy problems today.” We take that mission seriously, so the new website reflects that in several ways. First, we put a face to the designers and engineers and staff that you often speak to.  You can also read some of our engineer’s thoughts on the home page, as well as get to know them a little better via our team page, another new section of the site.


You’ll also see quotes from our customers and why they use SepiSolar for their design and engineering services. Blogs will also be more personal and written by specific team members, not a nameless admin.

Finally, you might also notice a new FAQ button on our website. These are all general questions that we often here, but you’re always welcome to contact us directly for your personal question. If you’re new to SepiSolar and need a quote for design or technical consulting, well, there’s a big orange button in the top right of every page. There you can register for our SepiPortal and get a fast estimate for one or several designs. Already registered? Log in, as usual, using the red SepiPortal button at the top right of every page.


That’s the new SepiSolar.com new website tour. If you find a broken link or have other improvement suggestions, please let us know at blogs@sepisolar.com (also new!)

It’s always a team effort here at SepiSolar, but I have to give a special shout-out to Lean Digital Systems, our web designers. If you love this website, we’re confident they’ll create a beautiful, personal, and user-friendly solar website for your solar or energy storage company too!


CA Small Business Enterprise

Certification ID:
2015743

Bidder/Supplier ID:
BID0068933

NAICS Codes:
541330 – Engineering services
541340 – Drafting services
541490 – Other specialized design services
541618 – Other management consulting services
541690 – Other scientific and technical consulting services
541990 – All other professional, scientific, and technical services

D-U-N-S number:
065817064
CAGE:
8F5K7

UNSPSC Code:
811024, 81101701, 81101516, 81101604, 43232614, 81101505


Subscribe to the SepiSolar newsletter:


Subscribe Now